There are (something like) 51 million words in the records of the King’s Bench during the reign of Edward III
Handwriting Text Recognition
Published
November 10, 2023
Estimating the scope of the records of the Court of the King’s Bench 1327-1377
Obviously claiming to know the number of words in the records of the King’s Bench is highly dubious but I wanted to carry out a very vague estimate of the amount of content to convey the sheer quantity of the surviving records.
I was writing an email to someone about my project, the development of a Handwriting Text Recognition (HTR) model based on the fourteenth century records of the court of the King’s Bench, and I decided to add a throwaway line to give an idea of how much surviving material there is in the plea rolls of the Court of the King’s Bench (KB27) in the fourteenth century. Two days later I have a very rough estimate of the number of words but a better idea of the scale of the records. (I still haven’t actually sent the email). One of the most remarkable aspects of fourteenth century English administrative records is the quality and quantity of their survival. Therefore, I wanted to put something together to reflect this for the record class I am currently looking at as part of my Leverhulme funded project at the University of Antwerp.
The court of the King’s Bench was the most senior criminal court in England for most of its existence (c. 1200-1600). The surviving records, held at The National Archives at Kew, are, as my son would say, giantnormus. That is, the rolls themselves are quite large but there are also a lot of them. For my current project I have transcribed a decent amount and it occurred to me that I could use this as a very very rough estimate of the total volume of material.
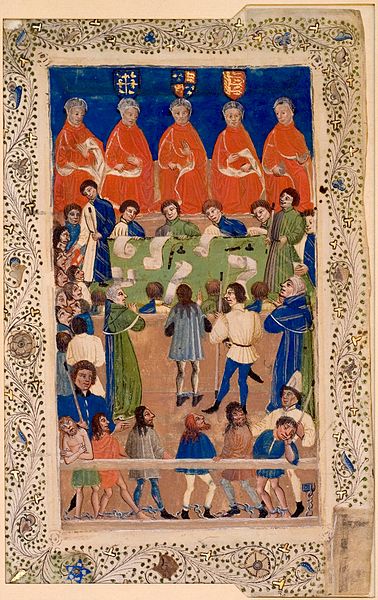
The earliest surviving image of the Court of the King’s Bench from Wikipedia. You can see the rolls produced by the court throughout.
To build a HTR model it is first necessary to create a set of transcriptions that are aligned with images of the records and which is 100% accurate. It is this data that the machine learning algorithm uses to train a HTR model which can then automate transcription of future, unseen, images.
I am currently experimenting with using the images from the Anglo-American Legal Tradition (AALT) website as the basis for my HTR model. This is because this project has millions of images of these administrative records, from 1199 to 1879, publicly available. They are not without problems as the quality is variable and it is sometimes hard to reconstruct the original sequence of the records. Despite this, if I can get the HTR model working satisfactorily on these images then a significant portion of the labour will be eliminated. It can also act as a pilot study to demonstrate that a HTR approach is possible using AALT photos - something which would be revolutionary given the huge number of photos on the website.
Therefore, as part of the work I have already carried out, I have transcribed a decent amount of the KB27 images from the AALT website. Given this, I thought I could average the number of words per photo from my transcriptions and then use that to estimate the number of words in these records across the reign of Edward III (1327-77). You can see an example of one of these photos and transcriptions within the Transkribus platform in the photo below
A photo of the King’s Bench records taken as part of the AALT project transcribed and tagged in Transkribus
Counting the Photos
The first stage was involved working out how many KB27 photos were on the AALT website for this period. This involved a lot of pain and two days writing a Python script which could query the website for the number of images on each relevant page.
This was made more difficult due to the (understandable) idiosyncrasies of the AALT website. Directing the script toward the right pages and sub-links and then troubleshooting where the AALT URLs deviated from the expected format took quite a while. I also had to build a delay into the script and instruct it to access the pages sequentially rather than all at once so as to not flood the website with requests. These aspects meant I had to leave the script to run for several hours.
The result was a datasheet with all the relevant figures which show that there are 117,704 images on pages which contain images of KB27 records in the course of Edward III’s reign.
This is certainly not the exact number of photographs of KB27 records for two reasons. Firstly, at least one KB entry points to the wrong URL (and so half of one roll was uncounted). And secondly, the script also counts the small number of images which are part of the overall website design. Given that these appear on each page then the total numbers are quite significant.
On the AALT website there are always several images of the manuscript which do not contain any text. This includes the initial photographs which show the roll in its entirety, the flyleaves, images which denote the division between civil and crown pleas, and often photos at the end which simply indicate that they are the last photo in the roll. There are occasionally further blank images within the photographs but it is difficult, if not impossible, to estimate these without combing through 100,000 images.
The figures
So, as an estimate, perhaps twelve images per roll do not contain textual information. Given there are 199 rolls for Edward’s reign then we should discount about 2,388 photos. However, we should also eliminate the banner images and the arrow gifs. These appear on every AALT page consistently although the number of arrow gifs, used to navigate between pages, vary slightly depending on the nature of each particular roll. Therefore, we can use an estimate of six per page queried which gives us 2,400. Subtracting these from the total figures gives us a number of 112,916. This is slightly lower than the probable actual figures as we overestimated incorrect or blank images and we are missing at least half of one roll, which is usually around 300 images.
So far, I have transcribed 20,861 words across 46 photos which gives us an average of 453.5 words per photo. So therefore, based on these envelope calculations I estimate that there is something like 51,207,406 words in the KB27 records for Edward III’s reign. Obviously at this scale even a small change in the suggested average per photo can have large effects.
This estimate will improve as I transcribe more records, develop the HTR model, and use it to automate transcription of more images. As I gain more data about the number of words per AALT image then the average number of words will be more realistic. My goal is at least 1,000 transcribed images which would be around 1% of the total KB27 images.
Regardless we can look at some figures for the number of photos per year of Edward’s reign. While there are some interesting trends we must bear in mind that it some factor of this may be due to variance within the photographic practice rather than variance within the records themselves. Given I have saved the data from the AALT website scrap as a CSV file I can read this into RStudio and produce a plot to visualise the changing numbers of photos for each year from 1327 to 1377.
# Load the dataimageCounts <-read_csv('regnalYearsIMG.csv')
Rows: 400 Columns: 5
── Column specification ────────────────────────────────────────────────────────
Delimiter: ","
chr (1): URL
dbl (4): imageCount, regnalYears, KB_Ref, calendarYear

ℹ Use `spec()` to retrieve the full column specification for this data.
ℹ Specify the column types or set `show_col_types = FALSE` to quiet this message.
# Group by calendarYear column and summarize the total count of images per calendarYeardata_grouped <- imageCounts %>%group_by(calendarYear) %>%summarise(totalImageCount =sum(imageCount))# Plot of the number of AALT photos by Regnal Years during the reign of Edward IIIimagePlot <-ggplot(data_grouped, aes(x = calendarYear, y = totalImageCount)) +geom_col(fill="#ffd700", position ="dodge", width =0.8) +# Adjust width for spacinglabs(title ="Total KB27 AALT Images by Year for the reign of Edward III (c.1327-77)") +ylab(NULL) +# Remove labels for each axisxlab(NULL) +coord_flip() +# Flipping the coordinatestheme_minimal() +# Set the theme for the plottheme(plot.title =element_text(hjust =0.5), # Centre the titlepanel.grid.major =element_blank(),panel.grid.minor =element_blank(),panel.background =element_blank(),axis.text.x =element_text(angle =0, hjust =0.5), # Make x-axis labels horizontalaxis.ticks.x =element_line(color ="black") # Ensure x-axis tick marks are visible )imagePlot
Immediately the discrepancy between the volume of photographs before and after 1349 stands out. Despite the rough nature of using the AALT photo numbers to draw conclusions, given the emergence of the Black Death in England in this period, I am inclined to believe that this change results from a variation in the underlying records rather than diverging photographic approaches. However, 1349 does not represent the lowest number of photographs across the period in question. If we exclude the last year of Edward’s reign (an incomplete regnal year), then there are fewer images for the records of both 1368 and 1371.
# Here we take the data in the dataframe `data_grouped` sort the column `totalImageCount` by # descending order and then show the first ten results.data_grouped %>%arrange(totalImageCount) %>%slice_head(n=10)
While these figures are rough and ready I anticipate (perhaps incorrectly) that the accuracy of my estimates will improve as the HTR model begins to deliver results. This should occur regardless of the accuracy of the model since it will still detect words even if it inaccurately transcribes them. The process by which I arrived at the figures demonstrates the utility of digital approaches to explore source material. While often they allow us only to perform traditional inquiries more rapidly they are also able to operate at such scale and speed that we can ask, and answer, new questions as well. These kinds of approaches are only going to become more common as larger volumes of medieval source material become more amenable to digital tools. The AALT website has already done so much to aid the accessibility of these records and is used daily by so many across the world. Hopefully, my project can help to take this one step further.